Numpy
Table of Contents
1 Numpy
Numpy 是 Python 科学计算的基础包,主要有以下一些功能:
- N 维数组
- 线性代数,傅里叶变换等
import numpy as np
2 基本用法
Numpy 的数组类是 ndarray ,它的别名是 array 。主要 numpy.array 和 Python
自带的 array.array 是不同的。
| 属性 | 含义 |
|---|---|
| arr.ndim | 维度 |
| arr.shape | 每个维度的大小 |
| arr.size | 数组的所有元素个数 |
| arr.dtype | 元素的数据类型 |
| arr.itemsize | 每个元素的字节数 |
| arr.data | 实际数据的引用 |
a0 = np.arange(24).reshape((2, 3, 4))
print(a0)
print(a0.ndim)
print(a0.shape)
print(a0.size)
print(a0.dtype)
print(a0.itemsize)
print(a0.data)
[[[ 0  1  2  3]
  [ 4  5  6  7]
  [ 8  9 10 11]]

 [[12 13 14 15]
  [16 17 18 19]
  [20 21 22 23]]]
3
(2, 3, 4)
24
int32
4
<memory at 0x0000021786B458B8>
Numpy 数组和普通数组的区别如下
a0 = [1, 2, 3]
print(a0)
print(type(a0))
b0 = np.array([6, 7, 8])
print(b0)
print(type(b0))
[1, 2, 3]
<class 'list'>
[6 7 8]
<class 'numpy.ndarray'>
3 创建数组
a1 = np.array([1, 2, 3, 4])
a2 = np.array([(1.5, 2, 3), (4, 5, 6)])
a3 = np.array([[1, 2], [3, 4]], dtype=complex)
print(a1)
print(a2)
print(a3)
[1 2 3 4]
[[1.5 2.  3. ]
 [4.  5.  6. ]]
[[1.+0.j 2.+0.j]
 [3.+0.j 4.+0.j]]
4 初始化数组
Numpy 初始化数组一般是生成一定维度的列表,具体如下
np.zeros((3, 4))
np.ones((2, 3, 4), dtype=np.int16)
np.empty((2, 3))

np.arange(10, 30, 5)  # samillar to range()
np.arange(1, 2, 0.3)  # but accept float

from numpy import pi
np.linspace(0, 2, 9)
x = np.linspace(0, 2 * pi, 10)
y = np.sin(x)

print(list(zip(x, y)))
[(0.0, 0.0), (0.6981317007977318, 0.6427876096865393), (1.3962634015954636, 0.984807753012208), (2.0943951023931953, 0.8660254037844387), (2.792526803190927, 0.3420201433256689), (3.490658503988659, -0.34202014332566866), (4.1887902047863905, -0.8660254037844385), (4.886921905584122, -0.9848077530122081), (5.585053606381854, -0.6427876096865396), (6.283185307179586, -2.4492935982947064e-16)]
随机生成数组,获取一些统计信息
a0 = np.random.random((2, 3))
print(a0)
print(a0.min(), a0.max())
print(a0.sum())
print(a0.mean())

a1 = np.random.normal(0, 0.1, 10)  # mu, sigma, count
print(a1[a1 > 0])
print(a1.mean())
[[0.9252851  0.7129627  0.40223125]
 [0.90696639 0.43173784 0.03253335]]
0.0325333525900483 0.9252851004000952
3.4117166388143234
0.5686194398023873
[0.11057307 0.07345595 0.06929216 0.13555647]
-0.03848054532856991
可以通过 Reshape 快速地修改 Python 数组的维度,这个方法非常有用
a1 = np.arange(12)
print(a1)
a2 = a1.reshape(4, 3)
print(a2)
print(a2.shape)
[ 0  1  2  3  4  5  6  7  8  9 10 11]
[[ 0  1  2]
 [ 3  4  5]
 [ 6  7  8]
 [ 9 10 11]]
(4, 3)
当给出数组的维度为 -1 时,代表需要自推导维度大小
a0 = np.arange(30)
a0.shape = 2, -1, 3  # -1 means "whatever is needed"
print(a0.shape)

a1 = a0.reshape(-1, 10)
print(a1.shape)
(2, 5, 3)
(3, 10)
5 拼接数组
可以使用 vstack 或者 hstack 来拼接数组,不过这样的效率比较低,一般建议直接初始 化对应大小的数组,然后使用 reshape
a1 = np.arange(4).reshape((2, -1))
a2 = a1 + 20

a3 = np.vstack((a1, a2))
print(a3)

a4 = np.hstack((a1, a2))
print(a4)
[[ 0  1]
 [ 2  3]
 [20 21]
 [22 23]]
[[ 0  1 20 21]
 [ 2  3 22 23]]
6 基本运算和矩阵相关算法
Numpy 重载了 Python 的数学操作符,基本操作如下
a = np.array([20, 30, 40, 50])
b = np.arange(4)
c = a - b
print(b**2) # power
10 * np.sin(a)
print(a < 35)
[0 1 4 9]
[ True  True False False]
矩阵的乘法和矩阵里面每个元素相乘
A = np.array([[1,1], [0,1]] )
B = np.array([[2,0], [3,4]] )
print(A * B)        # elementwise product
print(A @ B)        # matrix product
print(A.dot(B))     # another matrix product
[[2 0]
 [0 4]]
[[5 4]
 [3 4]]
[[5 4]
 [3 4]]
基本线性代数的操作
a0 = np.array([[1.0, 2.0], [3.0, 4.0]])
a1 = a0.T # same as a0.transpose()
print(a1)

a2 = np.linalg.inv(a0)
print(a2)

I = np.eye(2)
J = np.array([[0.0, -1.0], [1.0, 0.0]])
J2 = J @ J  # matrix product
T0 = np.trace(I)  # trace
y = np.array([[5.], [7.]])
res1 = np.linalg.solve(a0, y)
print(res1)
res2 = np.linalg.eig(j)
print(res2)
[[1. 3.]
 [2. 4.]]
[[-2.   1. ]
 [ 1.5 -0.5]]
[[-3.]
 [ 4.]]
(array([0.69722436, 4.30277564]), array([[-0.60889368, -0.3983218 ],
       [ 0.79325185, -0.91724574]]))
7 深度复制 copy 方法
a0 = np.arange(6)
b0 = a0.copy()        # a new array object with new data is created
print(b0)
[0 1 2 3 4 5]
8 索引
Numpy 的索引是一个比较有用的操作,可以实现快速操作,防止进行使用速度比较慢的 for 循环,同时也可以使代码读起来比较简洁
8.1 使用 Indices 索引
a0 = np.arange(12)**2  # the first 12 square numbers
print(a0)
print(a[2])  # the elements of a at the positions i

b0 = np.array([1, 1, 3, 8, 5])  # an array of indices
print(a0[b0]) # get elements with indices as b0
[  0   1   4   9  16  25  36  49  64  81 100 121]
40
[ 1  1  9 64 25]
在实际工程可以使用下标索引来掩码 (mask),挑选出对应的色块
palette = np.array([
    [0, 0, 0],  # black
    [255, 0, 0],  # red
    [0, 255, 0],  # green
    [0, 0, 255],  # blue
    [255, 255, 255]  # white
])
image = np.array([
    [0, 1, 2, 0],  # each value corresponds to a color in the palette
    [0, 3, 4, 0]
])
res = palette[image]  # the (2,4,3) color image
print(res)
[[[  0   0   0]
  [255   0   0]
  [  0 255   0]
  [  0   0   0]]

 [[  0   0   0]
  [  0   0 255]
  [255 255 255]
  [  0   0   0]]]
a0 = np.arange(12).reshape(3, 4)
i = np.array([[0, 1], [1, 2]])  # indices for the first dim of a
j = np.array([[2, 1], [3, 3]])  # indices for the second dim
print(a0)

a1 = a0[i, j]  # i and j must have equal shape
print(a1)

b1 = a0[i, 2]
print(b1)

b2 = a0[:, j]  # i.e., a[ : , j]
print(b2)
[[ 0  1  2  3]
 [ 4  5  6  7]
 [ 8  9 10 11]]
[[ 2  5]
 [ 7 11]]
[[ 2  6]
 [ 6 10]]
[[[ 2  1]
  [ 3  3]]

 [[ 6  5]
  [ 7  7]]

 [[10  9]
  [11 11]]]
8.2 使用布尔值索引
Numpy 支持使用条件
a0 = np.arange(6).reshape(3, 2)
b0 = a0 > 4
print(b0)
print(a0[b0])  # 1d array with the selected elements

a0[b0] = 0  # All elements of 'a' higher than 4 become 0
print(a0)
[[False False]
 [False False]
 [False  True]]
[5]
[[0 1]
 [2 3]
 [4 0]]
多维度的索引
a0 = np.arange(10).reshape(2, -1)
print(a0)
b1 = np.array([False, True])  # first dim selection
b2 = np.array([True, False, True, False, False])  # second dim selection
print(a0[b1, :])  # selecting rows
a0[b1]  # same thing
a0[:, b2]  # selecting columns
print(a0[b1, b2])  # a weird thing to do
[[0 1 2 3 4]
 [5 6 7 8 9]]
[[5 6 7 8 9]]
[5 7]
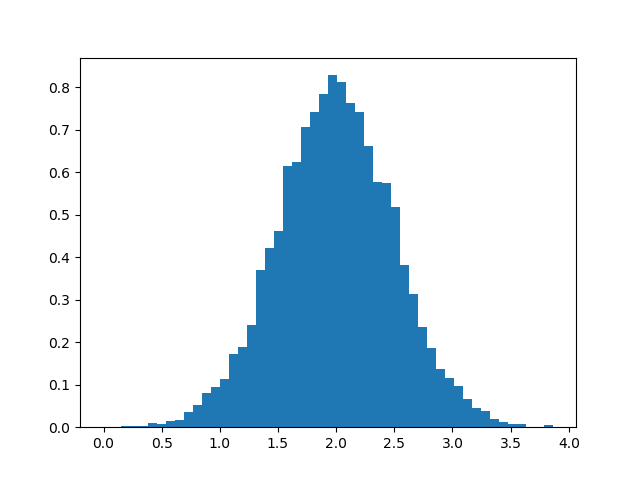
9 借助 matplotlib 画一些统计图
import numpy as np
import matplotlib.pyplot as plt
filename = '../static/image/2018/10/numpy1.png'

# Build a vector of 10000 normal deviates with variance 0.5^2 and mean 2
mu, sigma = 2, 0.5
v = np.random.normal(mu,sigma,10000)
# Plot a normalized histogram with 50 bins
plt.hist(v, bins=50, density=1)       # matplotlib version (plot)
plt.savefig(filename)
return filename
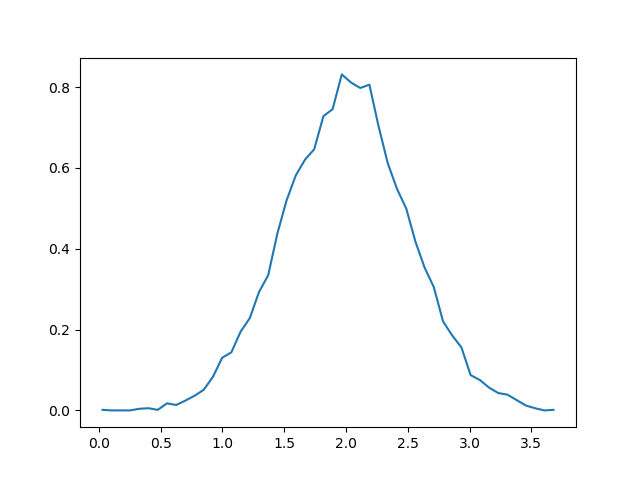
import numpy as np
import matplotlib.pyplot as plt
filename = '../static/image/2018/10/numpy2.png'

# Build a vector of 10000 normal deviates with variance 0.5^2 and mean 2
mu, sigma = 2, 0.5
v = np.random.normal(mu,sigma,10000)
# Compute the histogram with numpy and then plot it
(n, bins) = np.histogram(v, bins=50, density=True)  # NumPy version (no plot)
plt.plot(.5*(bins[1:]+bins[:-1]), n)
plt.savefig(filename)
return filename
10 安装 Numpy 和测试
使用 pip 安装
pip install numpy
运行 Numpy 自带的测试
python -c "import numpy; numpy.test()"