使用 dot 画图工具
Table of Contents
1 Graphviz 画图工具和 dot 语言
Graphviz 是一个由 AT&T 实验室启动的开源工具包,用于绘制 dot 语言脚本描述的图形。 类似微软的 visio,但是他和 visio 也有很大的不同,他是用代码绘图的,使用一种名 为 dot 的语言绘图,对于绘制复杂的流程图,类图等非常好用。 这种设计使得用户更关 注于逻辑关系,实现 "所思即所得"。Graphviz 的自动布局功能,无需人为干预就可以做 到 "最小化连线交叉"。 关于 dot 画图的一个非常好的文章见 Drawing graphs with dot
2 基本画图
dot 可以生成 GIF, PNG, SVG, PDF 和 PostScript 格式的图片。dot 语言画图的类别可 以分成以下两类:
digraph有向图graph无向图
2.1 图的基本元素
每种图中包含以下常见要素:
node节点edge边subgraph子图attr属性
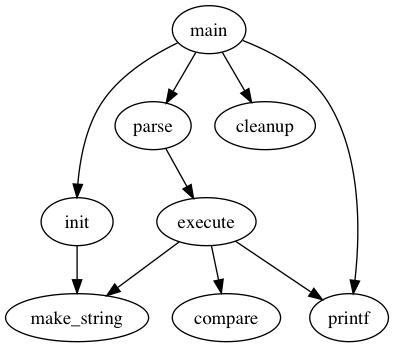
digraph basicGraph {
  main -> parse -> execute;
  main -> init;
  main -> cleanup;
  execute -> make_string;
  execute -> printf
  init -> make_string;
  main -> printf;
  execute -> compare;
}
- dot 语言中每个变量表示一个节点
->表示连接边- 使用 dot 命令编译生成 PNG 图片,示例如下:
dot -Tpng fig.dot -o fig.png
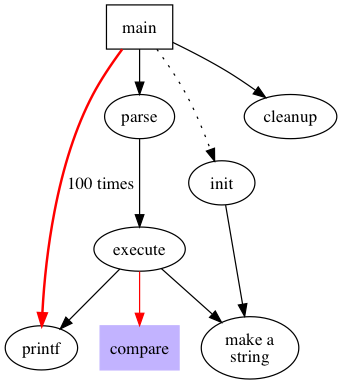
2.2 图的属性
在绘制图的时候一般需要根据需求来设置节点和边的属性,如下例子中
digraph graphAttrs {
  size ="4,4";
  main [shape=box];   /* this is a comment */
  main -> parse [weight=8];
  parse -> execute;
  main -> init [style=dotted];
  main -> cleanup;
  execute -> { make_string; printf}
  init -> make_string;
  edge [color=red];   // so is this
  main -> printf [style=bold,label="100 times"];
  make_string [label="make a\nstring"];
  node [shape=box,style=filled,color=".7 .3 1.0"];
  execute -> compare;
}
size设置图片大小为 4,4(英尺)- 节点和边的属性写在方括号里
shape=box设置节点形状为方框- 花括号表示一个节点连接多个节点
execute -> { make_string; printf}等同于execute -> make_string; execute -> printf; - 节点和边的文字可以使用
label属性来设置
3 图的属性介绍
主要的属性可以参考attrs。
3.1 节点形状
节点属性默认设置为 shape=ellipse, width=.75, height=.5 并且使用节点的名字作
为其 label 。节点的形状见 shapes 。
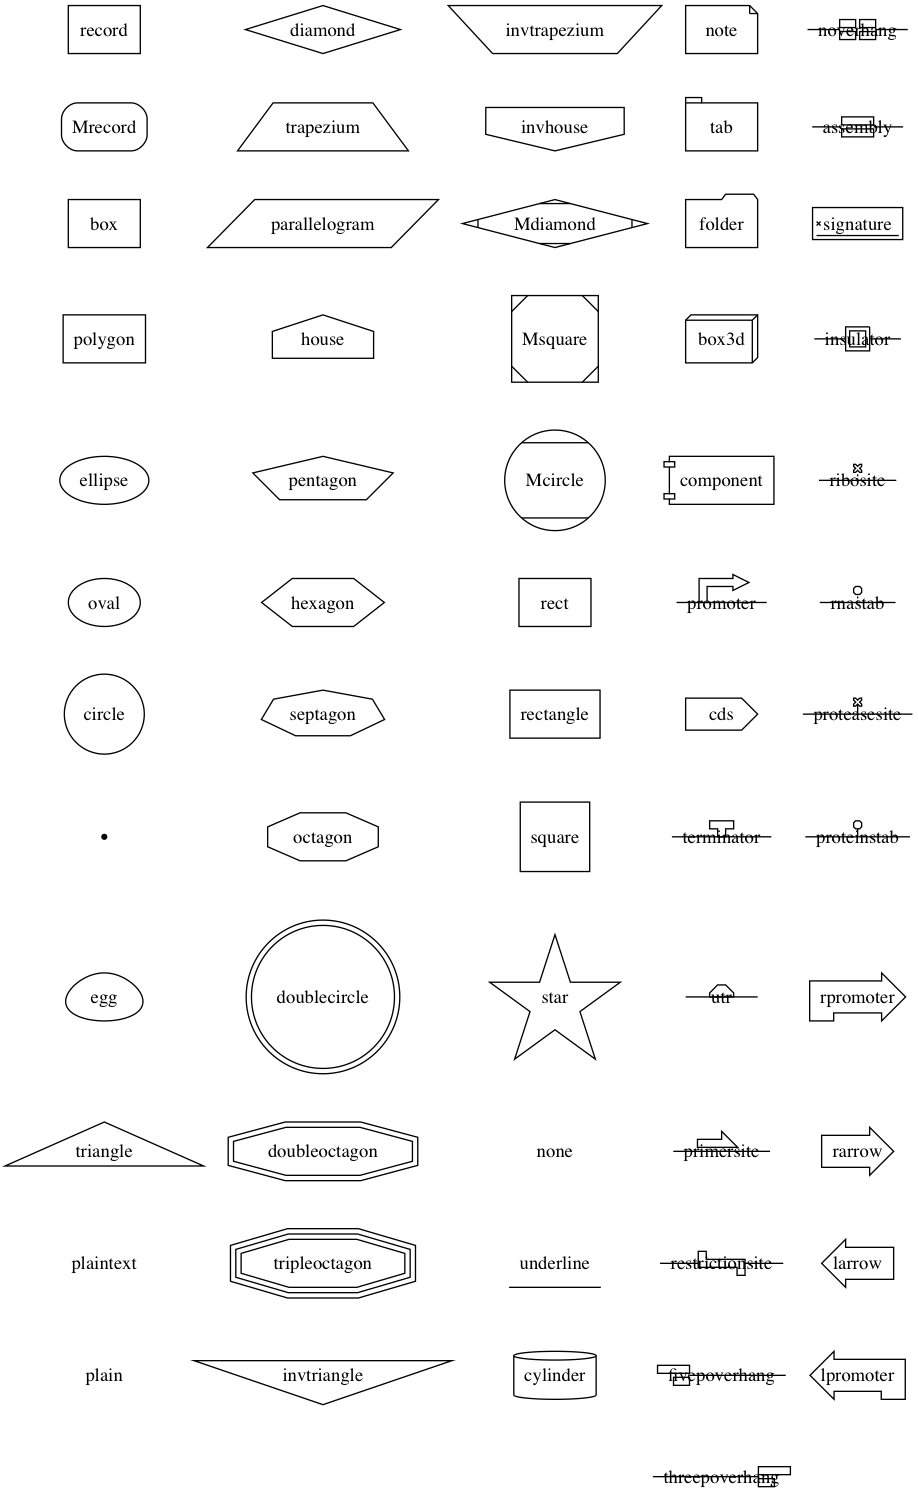
- 节点的形状分为两类
polygon-based和record-based - 除了
record和Mrecord属于record-based以外,其它都是polygon-based polygon-based一般直接作为形状record-based可以用于递归定义
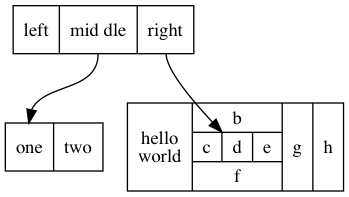
digraph graphLabel {
  node [shape=record];
  struct1 [label="<f0> left|<f1> mid\ dle|<f2> right"];
  struct2 [label="<f0> one|<f1> two"];
  struct3 [label="hello\nworld |{ b |{c|<here> d|e}| f}| g | h"];
  struct1:f1 -> struct2:f0;
  struct1:f2 -> struct3:here;
}
|用来分隔域<>里面是 fieldid- label 里面的空格和换行符需要转义
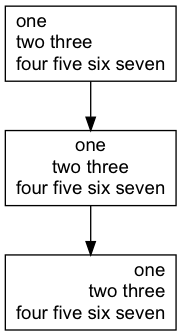
3.2 标签文字
标签文字默认是
- 换行需要转义,其中
\n,\l,\r分别表示换行居中,靠左和靠右。 - graph 和 cluster subgraph 也有 label,默认在图片正下方,
labelloc=t将 label 移到图的上方,labelloc=b将图片移到下面。labeljust=r文字靠右。 - 字体默认是 "Times-Roman 14", 可以设置
fontname,fontsize和fontcolor这些属性。例如:fontname=Helvetica - 边可以设置两端的 label,
headlabel和taillabel,以及 label 的字体labelfontname,labelfontsize和labelfontcolor,另外如果有需求也可以 设置labelangle和labeldistance
digraph graphTextAlign {
  node [shape=record fontname=Arial];
  a [label="one\ltwo three\lfour five six seven\l"]
  b [label="one\ntwo three\nfour five six seven"]
  c [label="one\rtwo three\rfour five six seven\r"]
  a -> b -> c
}
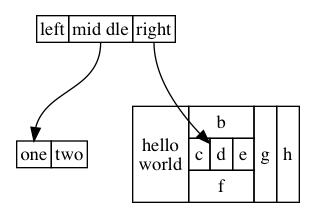
3.3 HTML 类型标签
digraph graphHtmlLabel {
  node [shape=plaintext]
  struct1 [label=<
           <TABLE BORDER="0" CELLBORDER="1" CELLSPACING="0">
           <TR><TD>left</TD><TD PORT="f1">mid dle</TD><TD PORT="f2">right</TD></TR>
           </TABLE>>];
  struct2 [label=<
           <TABLE BORDER="0" CELLBORDER="1" CELLSPACING="0">
           <TR><TD PORT="f0">one</TD><TD>two</TD></TR>
           </TABLE>>];
  struct3 [label=<
           <TABLE BORDER="0" CELLBORDER="1" CELLSPACING="0" CELLPADDING="4">
           <TR>
           <TD ROWSPAN="3">hello<BR/>world</TD>
           <TD COLSPAN="3">b</TD>
           <TD ROWSPAN="3">g</TD>
           <TD ROWSPAN="3">h</TD>
           </TR>
           <TR>
           <TD>c</TD><TD PORT="here">d</TD><TD>e</TD>
           </TR>
           <TR>
           <TD COLSPAN="3">f</TD>
           </TR>
           </TABLE>>];
  struct1:f1 -> struct2:f0;
  struct1:f2 -> struct3:here;
}
<TD>的 PORT 表示单元格的名称
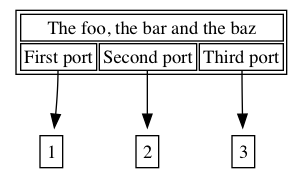
使用 Port
digraph graphPorts {

  parent [
   shape=plaintext
   label=<
     <table border='1' cellborder='1'>
       <tr><td colspan="3">The foo, the bar and the baz</td></tr>
       <tr><td port='port_one'>First port</td><td port='port_two'>Second port</td><td port='port_three'>Third port</td></tr>
     </table>
  >];

  child_one [
   shape=plaintext
   label=<
     <table border='1' cellborder='0'>
       <tr><td>1</td></tr>
     </table>
  >];

  child_two [
   shape=plaintext
   label=<
     <table border='1' cellborder='0'>
       <tr><td>2</td></tr>
     </table>
  >];

  child_three [
   shape=plaintext
   label=<
     <table border='1' cellborder='0'>
       <tr><td>3</td></tr>
     </table>
  >];

  parent:port_one   -> child_one;
  parent:port_two   -> child_two;
  parent:port_three -> child_three;

}
3.4 节点和边的样式
节点和边的颜色使用 color 属性来设置, color 接收以下几种类型的值:
- X11 的颜色名称,例如: red, yellow, green
- 0 到 1 之间表示 HSB 的三元组,例如: "0.83, 0.48, 0.85"
- 十六进制的 RGB 值,例如: "#DA70D6"
通过 fontcolor 和 fontname 设置字体颜色,例如: fontcolor=white;
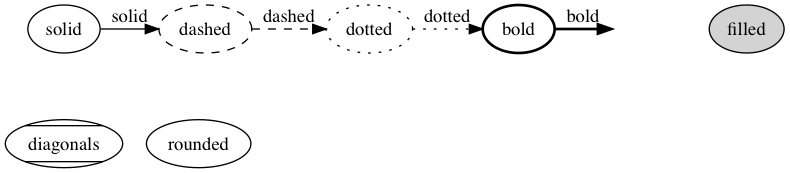
fontname=Helvetica; 。样式 style 也有预定义的值,线条属性包括: solid,
dashed, dotted, bold 和 invis;节点属性包括:filled, diagonals 和 rounded。
digraph graphStyle {
  solid -> dashed[style=solid; label=solid];
  dashed -> dotted[style=dashed; label=dashed];
  dotted -> bold[style=dotted; label=dotted];
  bold -> invis[style=bold; label=bold];
  solid -> diagonals[style=invis; label=invis];

  solid[style=solid];
  dashed[style=dashed];
  dotted[style=dotted];
  bold[style=bold];
  invis[style=invis];
  filled[style=filled];

  diagonals[style=diagonals];
  rounded[style=rounded];

  { rank=same solid dashed dotted bold invis filled}
  { rank=same diagonals rounded }
}
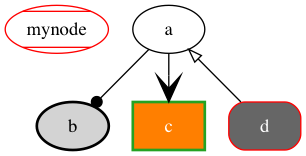
边有 dir 属性来设置箭头方向,包括:forward, back, both 和 none。还有一些可
以控制箭头的头和尾样式的属性 arrowhead 和 arrowtail 。箭头样式包括:
normal, inv, dot, invdot, odot, invodot, empty 和 none 等等。 arrowsize 设
置箭头的长度,例如 arrowsize=2.0 可以将箭头长度扩大两倍。
digraph graphArrows {
  mynode [color=red; style=diagonals];
  b[style="bold,filled"];
  c[shape=box,style="bold,filled",color="#24a222",fillcolor="#ff7f00"fontcolor=white];
  d[shape=Mrecord,style=filled,color="red",fillcolor="#666666"fontcolor=white];
  a -> b [arrowhead=dot];
  a -> c [arrowhead=vee; arrowsize=2];
  a -> d [dir=back, arrowtail=empty];
}
3.5 图的方向,大小和空隙
nodesep控制同样 rank 节点之间的最小的间距,单位是英尺ranksep控制不同 rank 之间的间距,单位是英尺。例如:ranksep=equally表 示所有的 rank 都是等距的size控制图片大小,单位是英尺。例如:size=x,y, 在命令行中使用-G选项ratio控制图片布局,例如:ratio=compress- 如果
ratio没有设置,根据size进行绘图 - 如果
ratio=x,x 是一个浮点数,对图片大小进行等比缩放 - 如果
ratio=fill并且size=x,y图片根据 x,y 来进行布局 - 如果
ratio=compress并且size=x,y根据 x,y 来布局,然后压缩图形 - 如果
ratio=auto并且设置page属性并且图不能在一页中画满,那么size将被忽略
- 如果
- 如果
rotate=90或者orientation=landscape,旋转 90 度水平作图 - 如果
page=x,y,则输出页的长宽 pagedir控制也的作图方向,例如pagedir=BL表示从下往上,从左往右作图Bbotttom-to-topLleft-to-rightTtop-to-bottomRright-to-left
center=true居中作图
3.6 节点和边的位置
节点和边的分别通过 rankdir 属性控制
LRleft-to-rightTBtop-to-bottomBTbottom-to-topRLright-to-left
对于有时间线的图,子图的 rank 可以设置为:
- same 子图中的所有节点属于同一个级别
- min 最小级别
- source 使得子图中的级别相同,并且严格小于其他节点
- max 最大级别
- sink
digraph graphRank {
  node [shape=record];
  { rank=same rA sA tA }
  { rank=same uB vB wB }
  rA -> sA;
  sA -> vB;
  t  -> rA;
  uB -> vB;
  wB -> u;
  wB -> tA;
}
![]()
4 高级特性
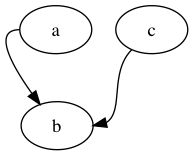
4.1 节点端口
每个节点有 8 个端口可以用于连接: "n", "ne", "e", "se", "s", "sw", "w" 和
"nw",其中 HTML 标签可以是 <TD> 中的 PORT 属性来指明端口。语法是使用
node_name:port_name
digraph graphNodePorts {
  a -> b [tailport=w];
  c:sw -> b:e;
}
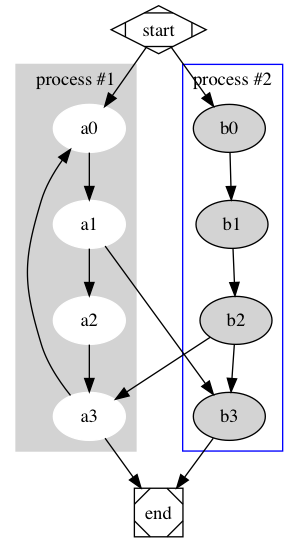
4.2 Cluster
Cluster 使用一个在特定矩形区域中的子图
- Cluster 的子图名称要以
cluster开头 - 如果
compound=true, dot 就会允许边将 cluster 和节点相连
digraph graphCluster {
  subgraph cluster_0 {
    style=filled;
    color=lightgrey;
    node [style=filled,color=white];
    a0 -> a1 -> a2 -> a3;
    label = "process #1";
  }

  subgraph cluster_1 {
    node [style=filled];
    b0 -> b1 -> b2 -> b3;
    label = "process #2";
    color=blue
  }
  start -> a0;
  start -> b0;
  a1 -> b3;
  b2 -> a3;
  a3 -> a0;
  a3 -> end;
  b3 -> end;

  start [shape=Mdiamond];
  end [shape=Msquare];
}
4.3 合并边
如果 concentrate=true 则 dot 会自动帮忙合并相同的边
5 杂项
strict graph 和 strict digraph 不允许建立重复的边,即每两个节点之间最多只
有一个边。
6 举例
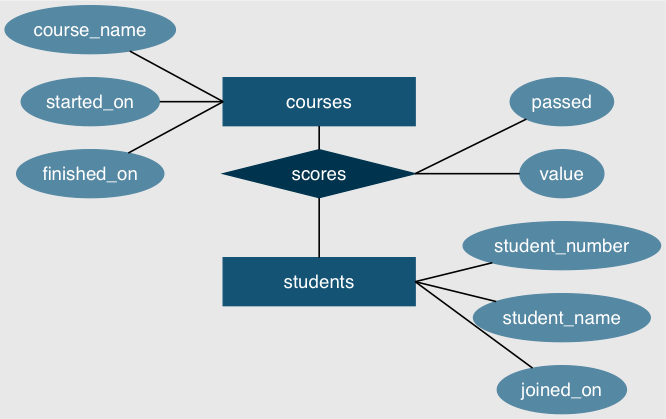
6.1 ER 图
graph ER_Diagram {
  rankdir="LR";
  bgcolor="#e8e8e8";
  compound=true;
  splines=false;

  node [fontname="Helvetia"; fontcolor="#ffffff"]

  node [shape=ellipse, style=filled, color="#5588a3"];
  student_number; student_name; joined_on;
  course_name; started_on; finished_on;
  value; passed;

  node [shape=box, style=filled, color="#145374", width=2];
  courses; students;

  node [shape=diamond, color="#00334e"];
  scores;

  edge[color="#000000", penwidth=1.2];
  {course_name; started_on; finished_on} -- courses:w ;
  scores:e -- {value; passed};
  students:e -- {student_number; student_name; joined_on};
  {
    rank=same
    courses -- scores -- students;
  }
}
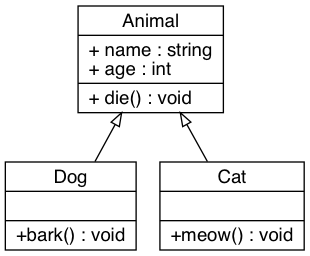
6.2 类图
digraph classDiagram {
  rankdir=TB;
  fontname="Helvetia";
  node[shape="record"; fontname="Helvetia"];
  edge[fontname="Helvetia", dir=back; arrowtail=empty;];

  animal [label="{Animal|+ name : string\l+ age : int\l|+ die() : void\l}"];
  dog [label="{Dog| | +bark() : void\l}"];
  cat [label="{Cat| | +meow() : void\l}"];

  animal -> dog;
  animal -> cat;
}